Table of Contents
.
Colin Zelts FAST code contains a program (nfd) to compute first arrival times in a square grid by solving the eikonal equation. An m-file wrapper is available in mGstat to easily call nfd
To use nfd form the FAST package the nfd binary must be copied to [MGSTAT_ROOT]/bin/nfd.
Compiling of the FAST codes is non trivial on the Linux platforms tested, using the Makefiles released as part of FAST. The help for compiling fast found here below, was tested on Linux (Redhat and Ubuntu) using goth F77 and the Intel Fortran Compiler (ifort) Download fast.tar.gz and compile 'nfd' using
wget http://terra.rice.edu/department/faculty/zelt/fast.tar.gz
tar xvfz fast.tar.gz
cd fast
find ./pltlib -name '*.f' -exec g77 -c {} \;
find ./fd -name '*.f' -exec g77 -c {} \;
g77 -o nfd main.o model.o time.o findiff.o findiff2d.o stencils.o stencils2d.o misc.o plt.o blkdat.o nopltlib.o
cp nfd [MGSTAT_ROOT]/bin/.
In addition you may need to change fd/fd.par to enabale models larger than nx*ny*nz = 601*100*25. Use for example
     parameter(nxmax=601, nymax=100, nzmax=225, ncolour=10,
     +          nsources=99)
Then you should be ready to use nfd.
To get rid of the message :FD: finite difference traveltime calculation, during each run of 'nfd' you can comment out lines 92-93 in fd/main.f, such that
      write(6,335)
335   format(/'FD: finite difference traveltime calculation')
is changed to
c      write(6,335)
c335   format(/'FD: finite difference traveltime calculation')
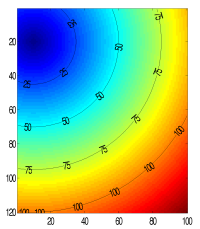
nx=100;ny=120;
x=[1:1:nx];
y=[1:1:ny];
v=ones(ny,nx);
S=[10 20];
t = fast_fd_2d(x,y,v,S);
imagesc(x,y,t);axis image
hold on
[cs,h]=contour(x,y,t,[25:25:100],'k-');
clabel(cs,h,'labelspacing',100)
hold off
fast_fd_2d_traveltime computes the traveltime between a set of Sources
(Sources) and Receivers
(Receivers)
Note that the size of Sources and Recivers MUST be the same. If you are ineterested in calculating the traveltime between all rays between a set of Sources and receivers consider using the section called “fast_fd_2d_traveltime_matrix”
nx=100;ny=120;
x=[1:1:nx];
y=[1:1:ny];
v=ones(ny,nx);
Sources  =[2 10 ; 2 80];
Receivers=[10 10;100 80];
t=fast_fd_2d_traveltime(x,y,v,Sources,Receivers)
plot(t);
xlabel('raynumber');ylabel('travel time')
fast_fd_2d_traveltime_matrix computes the traveltime from a number of sources
(Sources) to a number of Receivers
(Receivers)
nx=100;ny=120;
x=[1:1:nx];
y=[1:1:ny];
v=ones(ny,nx);
Sources=[2 10;2 80];
nr=40;
Receivers=[ones(nr,1)*nx-2,linspace(2,ny-1,nr)']
t=fast_fd_2d_traveltime_matrix(x,y,v,Sources,Receivers)
plot(t);
xlabel('raynumber');ylabel('travel time')
fast_fd_2d_clean deletes a large number of files from disk, generated running fast_fd_2d.
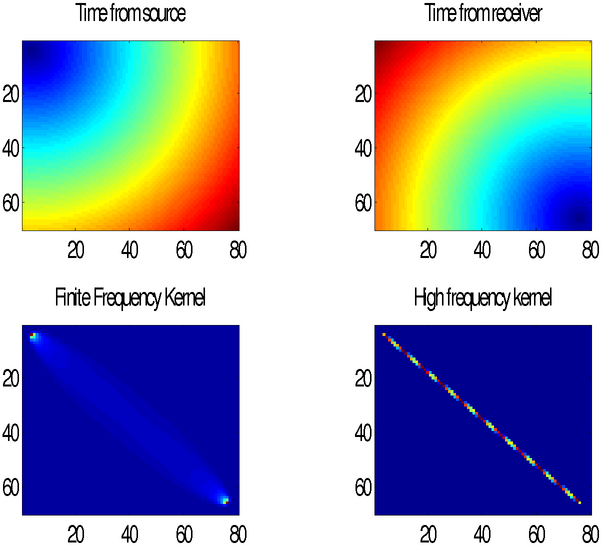
To calculate finite frequency and high frequency sensitivity kernel of one set og source and receivers use :
nx=80;ny=70;
x=[1:1:nx];
y=[1:1:ny];
z=1;
v=ones(ny,nx);  % Velocity field
S=[4 4];        % Sources
R=[nx-4 ny-4];  % Receiver

T=8;            % Dominant period
alpha=1;        %

[K,RAY,timeS,timeR,raypath,raylength]=kernel(v,x,y,z,S,R,T,alpha);
subplot(2,2,1);imagesc(x,y,timeS);title('Time from source');axis image
subplot(2,2,2);imagesc(x,y,timeR);title('Time from receiver');axis image
subplot(2,2,3);imagesc(x,y,K);title('Finite Frequency Kernel');axis image
subplot(2,2,4);imagesc(x,y,RAY);title('High frequency kernel');axis image
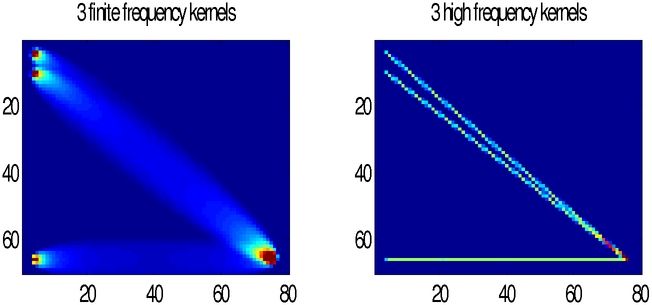
To calculate finite frequency and high frequency sensitivity kernel of more than one set og source and receivers kernel_multiple should be used, as this is more eficient than calling kernel many times:
nx=80;ny=70;
x=[1:1:nx];
y=[1:1:ny];
z=1;
v=ones(ny,nx);  % Velocity field
S=[4 4 ; 4 10 ;4 ny-4];        % Sources
R=[nx-4 ny-4;nx-4 ny-4;nx-4 ny-4];  % Receiver

T=8;            % Dominant period
alpha=1;        %

[K,RAY,Gk,Gray,timeS,timeR,raypath,raylength]=kernel_multiple(v,x,y,z,S,R,T,alpha);
subplot(1,2,1);imagesc(x,y,reshape(sum(Gk),ny,nx));title('3 finite frequency kernels');caxis([0 1]);axis image
subplot(1,2,2);imagesc(x,y,reshape(sum(Gray),ny,nx));title('3 high frequency kernels');axis image
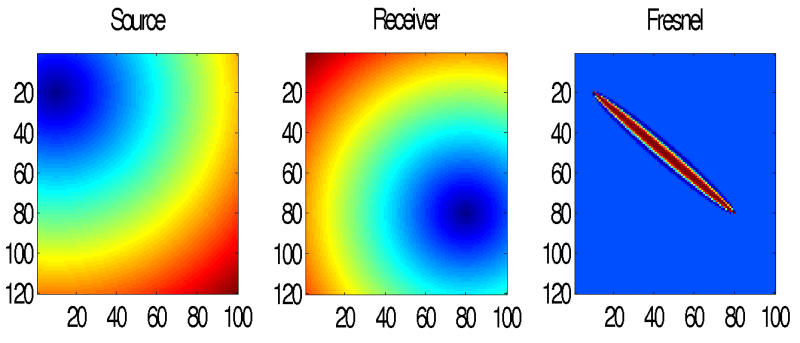
nx=40;ny=70;
x=[1:1:nx];
y=[1:1:ny];
v=ones(ny,nx);
SR=[4 4 ;nx-4 ny-4];
t = fast_fd_2d(x,y,v,SR);

dt=t(:,:,1)+t(:,:,2);
dt=dt-min(dt(:));
F = munk_fresnel_2d(1,dt);
subplot(1,3,1);imagesc(x,y,t(:,:,1));axis image;title('Source')
subplot(1,3,2);imagesc(x,y,t(:,:,2));axis image;title('Receiver')
subplot(1,3,3);imagesc(x,y,F);axis image;title('Fresnel')